22 May, 2014
Gallup Polls: Americans’ Satisfaction With Direction of U.S. Remains at Low 25%
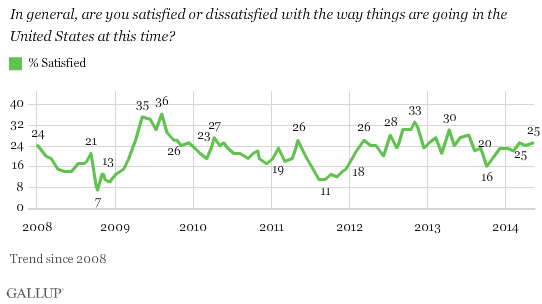
WASHINGTON, D.C., May 16, 2014, (Gallup media release) — Americans are as satisfied with the way things are going in the U.S. as they have been for the past five months. One in four (25%) say they are satisfied with current direction of the country, while 74% express dissatisfaction.

Americans’ satisfaction with the country’s direction has remained flat over the past year, with the major exception of a drop to a low of 16% in October 2013 during the U.S. federal government shutdown. Otherwise, satisfaction has not strayed from the 20% range since April of last year when it reached 30%. This month’s 25% is essentially the same as the 24% from April and the 25% reading in March. The latest findings are from a May 8-11 Gallup poll.
The high point for Americans’ satisfaction with the country’s direction during the Obama administration came in August 2009, when more than a third (36%) of Americans were satisfied with the direction of the country. The president entered office when 13% of Americans were content with the track the country was on. The lowest this figure reached under his leadership was 11% in August and September 2011, during a time of great economic angst.
Gallup has asked this question since 1979. Satisfaction reached an all-time high of 71% in February 1999 amid the dot-com boom. The lowest reading (7%) was measured in October 2008 as the nation grappled with the early effects of the 2008 global financial crisis.
Republicans Still Least Satisfied
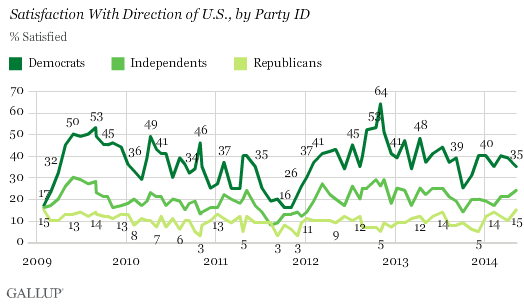
Democrats (35%) and independents (24%) continue to be more satisfied with the state of the nation than Republicans (15%). Although low, the current level of satisfaction among Republicans is, by one percentage point, at its highest level since January 2009 when President Barack Obama was inaugurated.

Democrats’ and Republicans’ satisfaction with the country is strongly tied to whether the president in office is in their party. Since Obama’s inauguration, Republican satisfaction has been consistently dismal, reaching its lowest of 3% on three separate occasions. Relatively speaking, however, Republicans have had a better outlook for the country’s direction in 2014, with levels not dipping below 10% so far this year. In previous years, however, levels went long stretches below the 10% mark — from June to December in 2011, from August 2012 to February 2013, and from August to December 2013. Republican satisfaction has averaged 13% so far this year, after averaging below 10% each year from 2010 to 2013.
Democrats’ satisfaction levels, meanwhile, have fallen slightly from last month’s 39%. Still, their current satisfaction reading falls in the six-point margin they have maintained since December 2013. Independents’ satisfaction levels have also stayed within a six-point margin on the question since December last year.
Bottom Line
Because 2014 has so far been largely devoid of any major political battles or sideshows, the waves of public opinion have been mostly calm and steady. Perhaps during a midterm election year partisan tensions could spark movement in the public’s view of what kind of track the country is on. Also, to the extent the signs of economic recovery continue and strengthen, Americans may become more satisfied with national conditions more generally.
Though they are likely to continue being the least optimistic about the nation’s direction, Republicans’ pessimism may have bottomed out in the aftermath of last year’s government shutdown, which jeopardized their party’s image politically. One possible key for the outcome of the midterm elections is whether independents’ level of satisfaction increases, decreases, or holds steady between now and November. An increase would likely be helpful to the Democratic Party, while a decrease could aid the Republicans’ cause.
Samples are weighted to correct for unequal selection probability, nonresponse, and double coverage of landline and cell users in the two sampling frames. They are also weighted to match the national demographics of gender, age, race, Hispanic ethnicity, education, region, population density, and phone status (cellphone only/landline only/both, and cellphone mostly). Demographic weighting targets are based on the most recent Current Population Survey figures for the aged 18 and older U.S. population. Phone status targets are based on the most recent National Health Interview Survey. Population density targets are based on the most recent U.S. census. All reported margins of sampling error include the computed design effects for weighting.
In addition to sampling error, question wording and practical difficulties in conducting surveys can introduce error or bias into the findings of public opinion polls.
View survey methodology, complete question responses, and trends.
For more details on Gallup’s polling methodology, visit www.gallup.com.


Liked this article? Share it!