3 Jul, 2014
Gallup Polls: Americans Losing Confidence in All Branches of U.S. Gov’t
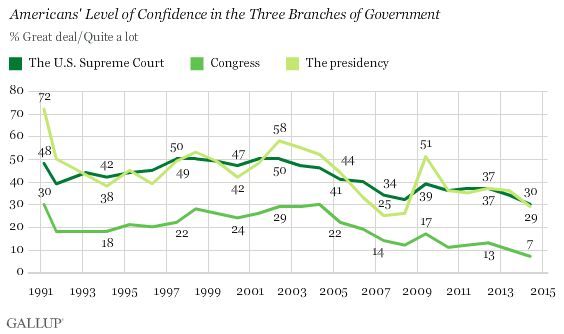
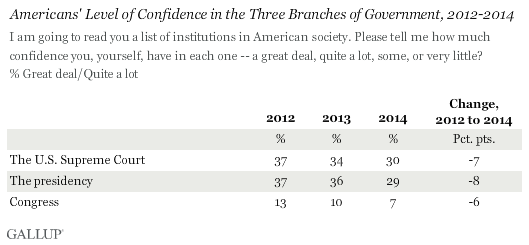
WASHINGTON, D.C., June 30, 2014 (Gallup Polls) — Americans’ confidence in all three branches of the U.S. government has fallen, reaching record lows for the Supreme Court (30%) and Congress (7%), and a six-year low for the presidency (29%). The presidency had the largest drop of the three branches this year, down seven percentage points from its previous rating of 36%.

These data come from a June 5-8 Gallup poll asking Americans about their confidence in 16 U.S. institutions — within government, business, and society — that they either read about or interact with.
While Gallup recently reported a historically low rating of Congress, Americans have always had less confidence in Congress than in the other two branches of government. The Supreme Court and the presidency have alternated being the most trusted branch of government since 1991, the first year Gallup began asking regularly about all three branches.
But on a relative basis, Americans’ confidence in all three is eroding. Since June 2013, confidence has fallen seven points for the presidency, four points for the Supreme Court, and three points for Congress. Confidence in each of the three branches of government had already fallen from 2012 to 2013.

Confidence in the presidency is now the lowest it has been under President Barack Obama, as is confidence in Congress and the Supreme Court, given their historical lows. When Obama first took office in 2009, each of the three branches saw a jump in confidence from their dismally low ratings in George W. Bush’s final two years in the White House.
Confidence in the Presidency, From George H.W. Bush to Obama
The president in office is not mentioned by name when the presidential confidence question is asked, but how positively Americans evaluate the current president has a direct impact on how much confidence Americans place in the presidency as an institution.
Gallup began asking regularly about the presidency in March 1991, when George H.W. Bush was in office. At that time, 72% of Americans had confidence in the presidency — the highest confidence rating the institution has received. This was immediately following his leadership in the successful first Persian Gulf War, and at a time when his job approval rating hit the then all-time high of 89%. But the elder Bush also saw the largest drop in confidence for the institution that same year, when it fell to a still relatively high 50% in October 1991.
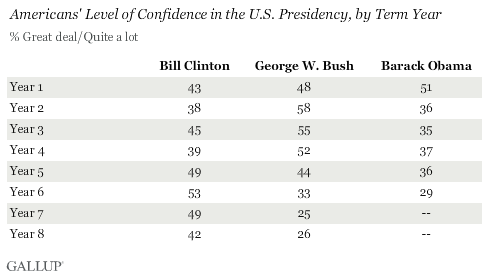
The three presidents who would succeed him would go on to be elected to two terms, with varying degrees of confidence in the executive branch of the U.S. government during those terms. Obama garnered the greatest first-year confidence rating, at 51% in 2009, but has held lower ratings than both Bill Clinton and George W. Bush in each subsequent year of his presidency so far.

George W. Bush’s presidency commanded the highest first-term confidence ratings due to the post-9/11 surge in support for government leaders and institutions, marked by a record job approval rating of 90% for Bush in September 2001 and continued high ratings for him in the months thereafter. His second-term approval ratings plummeted, however, and so did confidence in the presidency, reaching an all-time low of 25% in 2007.
Clinton had higher approval ratings during his second term thanks to a strong economy, and confidence ratings for the presidency improved as well. Compared with the sixth-year low that the presidency has reached under Obama this year, confidence in the institution registered at 53% for Clinton in June 1998. Even in the thick of the Monica Lewinsky scandal that year, Americans’ confidence in the presidency remained higher than for either of his successors in their sixth years in office.
New Low for Confidence in the U.S. Supreme Court
Gallup has tracked confidence in the Supreme Court since 1973. The institution’s record high of 56% was reached twice, in 1985 and 1988 — both times under former President Ronald Reagan. By 1988, Reagan had made all four of his contributions to the Supreme Court’s roster of confirmed justices.
From 1973 to 2006, the Supreme Court maintained confidence ratings in the 40s and 50s in all but one poll. That changed in 2007, a year after George W. Bush’s second confirmed nominee to the court — the Supreme Court’s confidence rating dropped sharply to 34%, along with similar declines in confidence in the other two branches of government. It has not reached 40% since.
In recent years, the presidency and the Supreme Court have often been closely rated in confidence by Americans, and in most polls since 1991, the two branches of government have been within six or seven points of each other in confidence ratings.
Bottom Line
While Americans clearly have the lowest amount of confidence in the legislative branch, ratings for all three are down and are at or near their lowest points to date. At this point, Americans place much greater faith in the military and the police than in any of the three branches of government.
Members of Congress are likely resigned to the fact that they are the most distrusted institution of government, but there should be concern that now fewer than one in 10 Americans have confidence in their legislative body. And Obama, like the younger Bush before him, is surely aware that the presidency’s low confidence rating is not auspicious for his ability to govern and rally the public behind his favored policies.
While the Supreme Court, with unelected justices serving indefinite terms, is immune to the same public pressures that elected members of Congress and the president must contend with, it is not immune to the drop in confidence in U.S. government institutions that threatens and complicates the U.S. system of government.
Survey Methods
Results for this Gallup poll are based on telephone interviews conducted June 5-8, 2014, with a random sample of 1,027 adults, aged 18 and older, living in all 50 U.S. states and the District of Columbia.For results based on the total sample of national adults, the margin of sampling error is ±4 percentage points at the 95% confidence level.
Interviews are conducted with respondents on landline telephones and cellular phones, with interviews conducted in Spanish for respondents who are primarily Spanish-speaking. Each sample of national adults includes a minimum quota of 50% cellphone respondents and 50% landline respondents, with additional minimum quotas by time zone within region. Landline and cellular telephone numbers are selected using random-digit-dial methods. Landline respondents are chosen at random within each household on the basis of which member had the most recent birthday.
Samples are weighted to correct for unequal selection probability, nonresponse, and double coverage of landline and cell users in the two sampling frames. They are also weighted to match the national demographics of gender, age, race, Hispanic ethnicity, education, region, population density, and phone status (cellphone only/landline only/both, and cellphone mostly). Demographic weighting targets are based on the most recent Current Population Survey figures for the aged 18 and older U.S. population. Phone status targets are based on the most recent National Health Interview Survey. Population density targets are based on the most recent U.S. census. All reported margins of sampling error include the computed design effects for weighting.
In addition to sampling error, question wording and practical difficulties in conducting surveys can introduce error or bias into the findings of public opinion polls.
For more details on Gallup’s polling methodology, visit www.gallup.com.


Liked this article? Share it!