7 Oct, 2013
Gallup Poll: Americans See Current Shutdown as More Serious Than in ’95
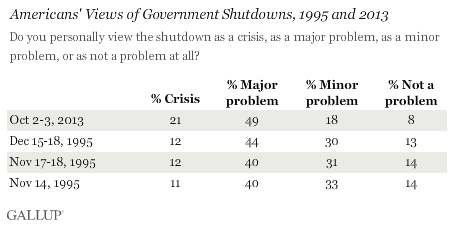
WASHINGTON, D.C. -October 4, 2013 – (Gallup poll) – As non-essential parts of the federal government remain closed, 70% of Americans view the shutdown as a crisis or a major problem, even higher than the 56% saying the same at the height of the last shutdown in 1995.

Leaders looking to gain ground in public opinion are not succeeding. A majority of Americans report feeling more negatively about the Republican and Democratic congressional leadership since the shutdown began, as well as about President Barack Obama. The negative reactions toward Obama are higher than Gallup recorded toward President Bill Clinton during the 1995 shutdown, while they are about the same toward the Republican leaders in Congress. Gallup did not ask about the Democratic leaders in 1995.
Americans this week express strong views of the shutdown — 21% say the closure is a crisis, while 49% believe it to be a major problem. That is more than peak negative sentiment seen during the last government shutdown, in 1995. In a five-week period that year, Americans’ views that the shutdown was a serious problem rose from 51% to 56%. The current shutdown began on Oct. 1, and resulted from Congress’ failure to agree on a continuing resolution to fund federal government operations.
By political affiliation, Democrats believe the shutdown to be a more serious problem than Republicans or independents do. Eighty-one percent of Democrats agree that it is a crisis or major problem, as opposed to 67% of Republicans and 64% of independents.
President Obama’s Shutdown Negatives Higher Than President Clinton’s
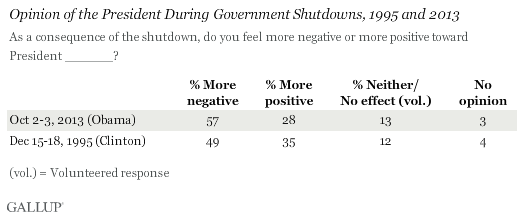
A majority of Americans, 57%, say they now view President Obama more negatively as a result of the shutdown, while 28% see him more positively. By contrast, during the December 1995 shutdown, 49% of Americans viewed Clinton more negatively and 35% more positively. Clinton’s overall approval rating would tumble to 42% by the end of the 1995-96 shutdown, but rebounded later in 1996.

Republican Leaders Viewed Roughly the Same as Last Shutdown
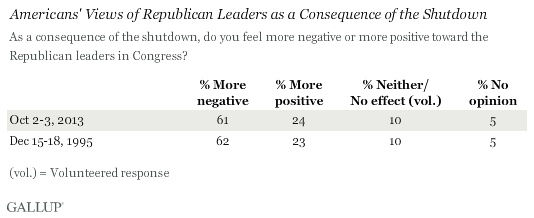
Sixty-one percent of Americans view Republican congressional leaders more negatively as a consequence of the shutdown. This mirrors the sentiment from December 1995, when 62% viewed Republicans more negatively. The 1995 shutdown occurred over partisan disagreements about funding for public health, Medicare, and the environment in the 1996 federal budget.

In the 2013 shutdown, control of Congress is divided, with Democrats in charge of the Senate and Republicans leading the House of Representatives. In 1995, Republicans had control of both chambers — hence, Gallup didn’t measure public reaction to Democratic congressional leaders during that shutdown.
In the current poll, 58% of Americans hold a more negative opinion of Democratic leaders — similar to their reaction to Republican leaders — while 26% are more positive.
Bottom Line
Among top U.S. political figures, there are no winners in the budget standoff, at least in the early days of the shutdown. The public sees Republican and Democratic congressional leaders, as well as the president, more negatively as a consequence of the budget impasse.
This sentiment is not new, of course. During the 1995 shutdown, U.S. opinion of President Clinton and Republican leaders dropped as well. For both shutdowns, Americans view the situation rather seriously and think of their leaders more negatively as a result. But today, the proportion who see the shutdown as a crisis or major problem is already quite high. In a year already marked by battles over the fiscal cliff and the sequester, developments that did not exist in 1995-96, Americans may be more tuned in to congressional turmoil and are reacting accordingly.
Survey Methods
Results for this Gallup poll are based on telephone interviews conducted Oct. 2-3, 2013, on the Gallup Daily tracking survey, with a random sample of 1,021 adults, aged 18 and older, living in all 50 U.S. states and the District of Columbia.
For results based on the total sample of national adults, one can say with 95% confidence that the margin of sampling error is ±4 percentage points.
Interviews are conducted with respondents on landline telephones and cellular phones, with interviews conducted in Spanish for respondents who are primarily Spanish-speaking. Each sample of national adults includes a minimum quota of 50% cellphone respondents and 50% landline respondents, with additional minimum quotas by region. Landline and cell telephone numbers are selected using random-digit-dial methods. Landline respondents are chosen at random within each household on the basis of which member had the most recent birthday.
Samples are weighted to correct for unequal selection probability, nonresponse, and double coverage of landline and cell users in the two sampling frames. They are also weighted to match the national demographics of gender, age, race, Hispanic ethnicity, education, region, population density, and phone status (cellphone only/landline only/both, and cellphone mostly). Demographic weighting targets are based on the March 2012 Current Population Survey figures for the aged 18 and older U.S. population. Phone status targets are based on the July-December 2011 National Health Interview Survey. Population density targets are based on the 2010 census. All reported margins of sampling error include the computed design effects for weighting.
In addition to sampling error, question wording and practical difficulties in conducting surveys can introduce error or bias into the findings of public opinion polls.


Liked this article? Share it!