28 Apr, 2014
Gallup Polls: Average U.S. Retirement Age Hits 62 as Baby-Boomers Opt to Work Longer
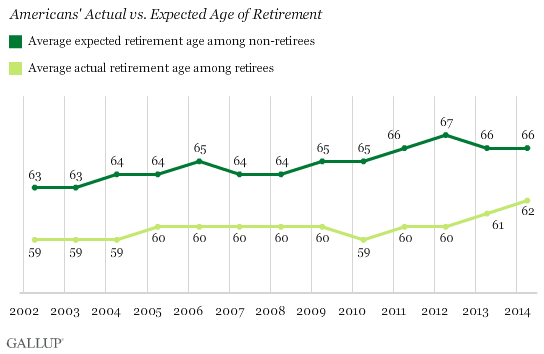
WASHINGTON, D.C., April 28, 2014 (Gallup Polls) — The average age at which U.S. retirees report retiring is 62, the highest Gallup has found since first asking Americans this question in 1991. This age has increased in recent years, while the average age at which non-retired Americans expect to retire, 66, has largely stayed the same. However, this age too has slowly increased from 63 in 2002.

These trends in Americans’ actual vs. expected age of retirement are from Gallup’s annual Economy and Personal Finance survey, conducted April 3-6, 2014. As part of that survey, Gallup asks retired Americans to report the age at which they retired, and non-retired Americans the age at which they expect to retire.
Americans’ average self-reported age of retirement has slowly moved upward. Gallup conducted several polls in the early 1990s and found that the average retirement age was 57 in both 1991 and 1993. From 2002 through 2012, the average hovered around 60. Over the past two years, the average age at which Americans report retiring has increased to 62.
Retirement age may be increasing because many baby boomers are reluctant to retire. Older Americans may also be delaying retirement because of lost savings during the Great Recession or because of insufficient savings even before the economic downturn.
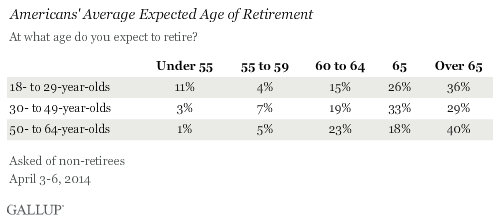
Meanwhile, the average age at which non-retired Americans expect to retire has also increased over time, from 60 in 1995 to 66 this year. Furthermore, in 1995, more non-retired Americans expected to retire younger — 15% expected to retire before age 55, compared with 4% in 2014.
The age at which Americans expect to retire has been consistently higher than the average age at which they actually retire since Gallup began tracking both. This likely reflects changes in Social Security eligibility as well as the more challenging economic circumstances working Americans currently face. Today’s workers are also less likely to have an employer-sponsored pension, and they may still be recovering financially from the Great Recession.
Young Americans Most Likely to Expect to Retire Before Age 55
About 30% of non-retired Americans in all age groups expect to retire before the age of 65. But 11% of 18- to 29-year-olds expect to retire before age 55, a much higher percentage than other groups. This could be because younger Americans, given the many years they have until retirement, may not understand the financial realities and challenges of funding retirement that middle-aged Americans are more familiar with.

The majority of all age groups expect to retire at age 65 or older. This includes 62% of 18- to 29-year-olds, 62% of 30- to 49-year-olds, and 58% of 50- to 64-year-olds. At the same time, an optimistic 15% of the youngest age group expect to retire before age 60. Adults closer to that age are naturally less likely to think they will be ready for retirement by that point.
The pressure to be financially prepared for retirement is evident in the recent Gallup finding that saving for retirement is Americans’ top financial worry.
According to a 2011 Wells Fargo/Gallup Investor and Retirement Optimism Index survey, the value of investments is the key factor determining when pre-retired investors say they will retire, followed by their health, the cost of healthcare, and inflation. However, according to a more recent Wells Fargo/Gallup survey, U.S. investors are highly cautious about retirement savings, saying they would prefer secure investments with low growth potential over investments with high growth potential and a risk of lost principal.
Implications
Although Gallup has always found a consistent gap in the age at which retired Americans report retiring and the age at which non-retirees expect to retire, both averages have crept up over the past decade. This likely reflects the changing landscape of retirement, including longer life spans, changes in Social Security benefits and employer-sponsored retirement plans, and lifestyle choices such as a desire to keep working after reaching the traditional retirement age.
Given these trends, Americans’ average retirement age being lower than their expected retirement age may reflect today’s retirees hailing from a different generation. In the future, the average retirement age and expected retirement age may converge as current workers retire later in life.
Survey Methods
Results for this Gallup poll are based on telephone interviews conducted April 3-6, 2014, with a random sample of 1,026 adults, aged 18 and older, living in all 50 U.S. states and the District of Columbia.
For results based on the total sample of national adults, the margin of sampling error is ±4 percentage points at the 95% confidence level.
For results based on the sample of 334 retirees, the margin of sampling error is ±7 percentage points.
For results based on the sample of 692 non-retirees, the margin of sampling error is ±5 percentage points.
Interviews are conducted with respondents on landline telephones and cellular phones, with interviews conducted in Spanish for respondents who are primarily Spanish-speaking. Each sample of national adults includes a minimum quota of 50% cellphone respondents and 50% landline respondents, with additional minimum quotas by time zone within region. Landline and cellular telephone numbers are selected using random-digit-dial methods. Landline respondents are chosen at random within each household on the basis of which member had the most recent birthday.
Samples are weighted to correct for unequal selection probability, nonresponse, and double coverage of landline and cell users in the two sampling frames. They are also weighted to match the national demographics of gender, age, race, Hispanic ethnicity, education, region, population density, and phone status (cellphone only/landline only/both, and cellphone mostly). Demographic weighting targets are based on the most recent Current Population Survey figures for the aged 18 and older U.S. population. Phone status targets are based on the most recent National Health Interview Survey. Population density targets are based on the most recent U.S. census. All reported margins of sampling error include the computed design effects for weighting.
In addition to sampling error, question wording and practical difficulties in conducting surveys can introduce error or bias into the findings of public opinion polls.
View survey methodology, complete question responses and trends.
For more details on Gallup’s polling methodology, visit www.gallup.com.


Liked this article? Share it!