26 Sep, 2014
Gallup Polls: Americans Continue to Say a Third Political Party Is Needed
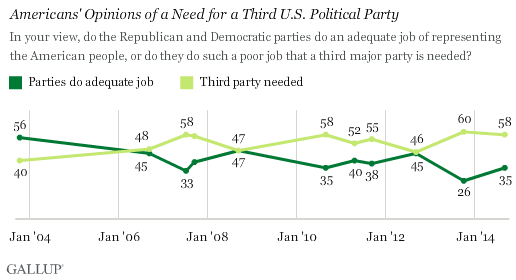
PRINCETON, NJ – September 24, 2014 – Gallup Polls – A majority of U.S. adults, 58%, say a third U.S. political party is needed because the Republican and Democratic parties “do such a poor job” representing the American people. These views are little changed from last year’s high. Since 2007, a majority has typically called for a third party.

The results are based on Gallup’s Sept. 4-7 Governance poll. The first time the question was asked in 2003, a majority of Americans believed the two major parties were adequately representing the U.S. public, which is the only time this has been the case. Since 2007, a majority has said a third party is needed, with two exceptions occurring in the fall of the 2008 and 2012 presidential election years.
The historical 60% high favoring a third party came in a poll conducted during the partial federal government shutdown last October. At that time, 26% of Americans said the parties were doing an adequate job. That figure is up to 35% now, but with little change in the percentage calling for a third party.
Americans’ current desire for a third party is consistent with their generally negative views of both the Republican and Democratic parties, with only about four in 10 viewing each positively. Americans’ views toward the two major parties have been tepid for much of the last decade. However, even when the party’s images were more positive in the past, including majority favorability for the Democrats throughout 2007 and favorability for the GOP approaching 50% in 2011, Americans’ still saw the need for a third party.
Independents Maintain Solid Preference for Third Party
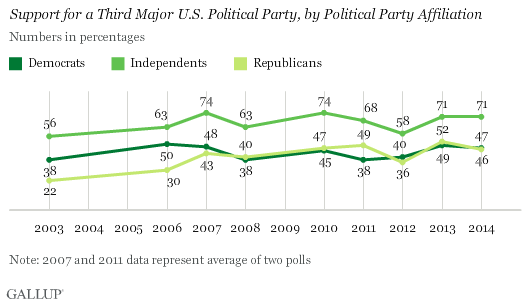
Political independents, as might be expected given a lack of allegiance to either major party, have shown a far greater preference for a third political party than those who identify as Republicans or Democrats. Currently, 71% of independents say a third party is needed, on the upper end of the trend line. That compares with 47% of Democrats and 46% of Republicans who say the same.

For most of the past 11 years, Republicans and Democrats were about equally as likely to favor a third party. From 2003 to 2006 — when Republicans had control of the presidency and both houses of Congress — Democrats were more likely than Republicans to see the need for a third party. And in 2011, after the rise of the Tea Party movement, Republicans were a bit more inclined than Democrats to see a third party as necessary.
Implications
Although Americans express a desire for a viable alternative to the Democratic and Republican parties, third political parties have had little success in American politics. The U.S. political system makes it difficult for third parties to hold elected office given the Electoral College system of electing presidents and election of members of Congress from individual states and districts based on the candidate getting the most votes. Such a system generally favors two parties — a center-right and a center-left party — that have the ability to assemble a winning plurality or majority in districts and states across the country. Also, some states have restrictive laws on ballot access that make it difficult for third-party candidates to appear on the ballot.
Third parties have had success in other countries when they had strong support in a particular region, or if members of the legislature were allocated proportionately to the nationwide vote each party received. This allowed third parties to hold seats with national vote shares usually well less than 30%.
Given the U.S. political system, those whose ideology puts them to the left of the Democratic Party or the right of the Republican Party are better served trying to work within a major political party than establishing their own party. Supporters of the Tea Party movement generally took this approach, with some success, by trying to get their preferred candidates nominated as Republicans in the last few election cycles. But as with most U.S. third parties historically, the Tea Party’s influence appears to be waning as the movement did not play a pivotal role in the 2012 Republican presidential nomination and was less successful in defeating more moderate Republican candidates in the 2014 congressional primaries than in 2010.
Though the desire for a third party exists, it is unclear how many Americans would actually support a third party if it came to be. Americans’ preference for a third party may reflect their frustration with the way the Republican and Democratic parties are performing, as well as the idea that the system ought to be open to new parties, regardless of whether this is viable in practice.
Survey Methods
Results for this Gallup poll are based on telephone interviews conducted Sept. 4-7, 2014, with a random sample of 1,017 adults, aged 18 and older, living in all 50 U.S. states and the District of Columbia.For results based on the total sample of national adults, the margin of sampling error is ±4 percentage points at the 95% confidence level.
Interviews are conducted with respondents on landline telephones and cellular phones, with interviews conducted in Spanish for respondents who are primarily Spanish-speaking. Each sample of national adults includes a minimum quota of 50% cellphone respondents and 50% landline respondents, with additional minimum quotas by time zone within region. Landline and cellular telephone numbers are selected using random-digit-dial methods. Landline respondents are chosen at random within each household on the basis of which member had the most recent birthday.
Samples are weighted to correct for unequal selection probability, nonresponse, and double coverage of landline and cell users in the two sampling frames. They are also weighted to match the national demographics of gender, age, race, Hispanic ethnicity, education, region, population density, and phone status (cellphone only/landline only/both, and cellphone mostly). Demographic weighting targets are based on the most recent Current Population Survey figures for the aged 18 and older U.S. population. Phone status targets are based on the most recent National Health Interview Survey. Population density targets are based on the most recent U.S. census. All reported margins of sampling error include the computed design effects for weighting.
In addition to sampling error, question wording and practical difficulties in conducting surveys can introduce error or bias into the findings of public opinion polls.
View survey methodology, complete question responses, and trends.
For more details on Gallup’s polling methodology, visit www.gallup.com.


Liked this article? Share it!